2016 Presidential Polls Post-Mortem
Where Trump beat the odds to become president
Trailing in the polls, disregarded by the vast majority of data and opinion experts, Donald Trump defied all odds last November and snatched the highest office in the country. Despite an amateur-looking campaign and a non-stop flow of scandals and gruesome remarks, his victory is—in terms of electoral college—wide and indisputable. While it may take years to understand how this political earthquake happened, a close observation of state-by-state results can provide preliminary insight into how Mr. Trump sealed the deal, and left pundits and pollsters scrambling with their predictions.
Using a Principal Component Analysis, we dispersed all 50 American states according to socio-economic and demographic variables such as age and ethnicity, wealth, employment, education, and obesity (the later inspired by an excellent piece of data-journalism in The Economist).
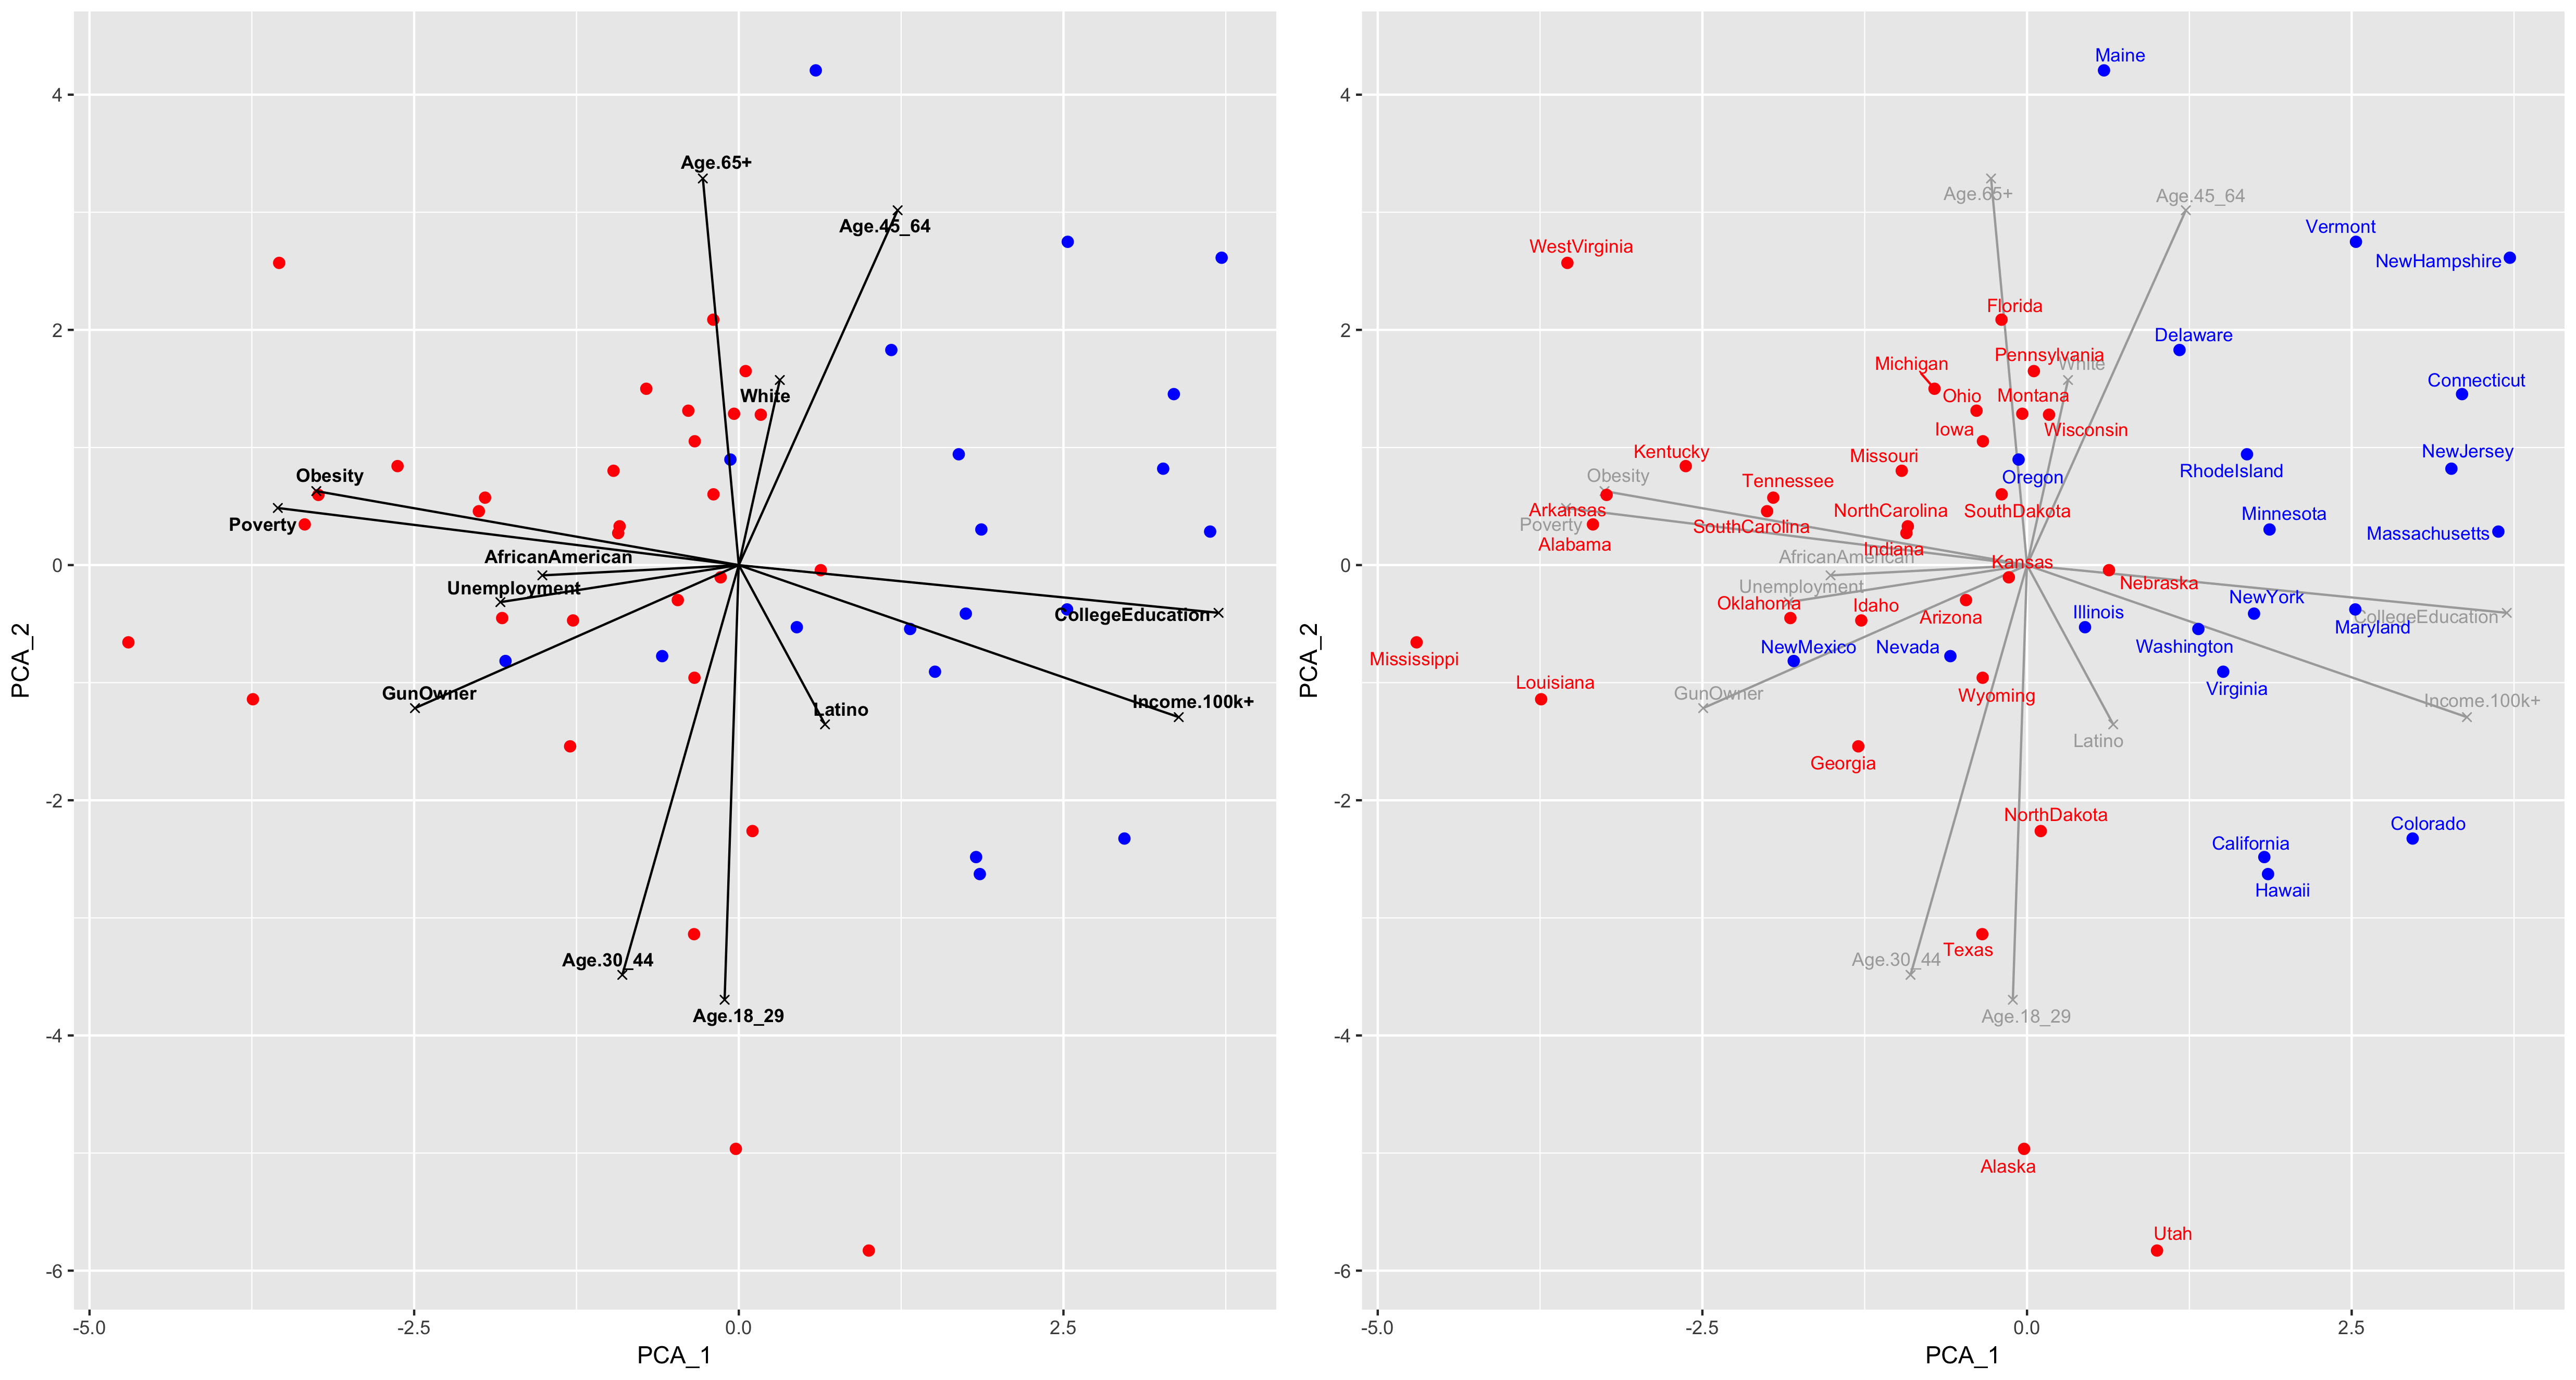
The first striking result is how relevant these variables are in clustering states by vote. The first PCA axis especially, which can be interpreted as the “Education-Earnings” axis, clearly splits states along party lines: Clinton and the Democratic Party lead in educated states with important levels of high-earners, while Trump runs the table in states with high unemployment and poverty rates. PCA Axis 2, which distinguishes younger states to older ones, is less explicative on the vote outcome – indicating that age might not be a relevant criteria in predicting vote. Exit polls reported by the New York Times show that although age groups still vote differently, the split isn’t as stark as in the previous election.
How Trump took the swing states
The American electoral college system makes an analysis of all 50 states of limited relevance, and it certainly does not reflect how campaigns are run and which populations are most courted by the candidates. We therefore restricted the analysis to 13 swing states, widely considered as the most competitive states and subject to the most polling in the run-up to the elections.
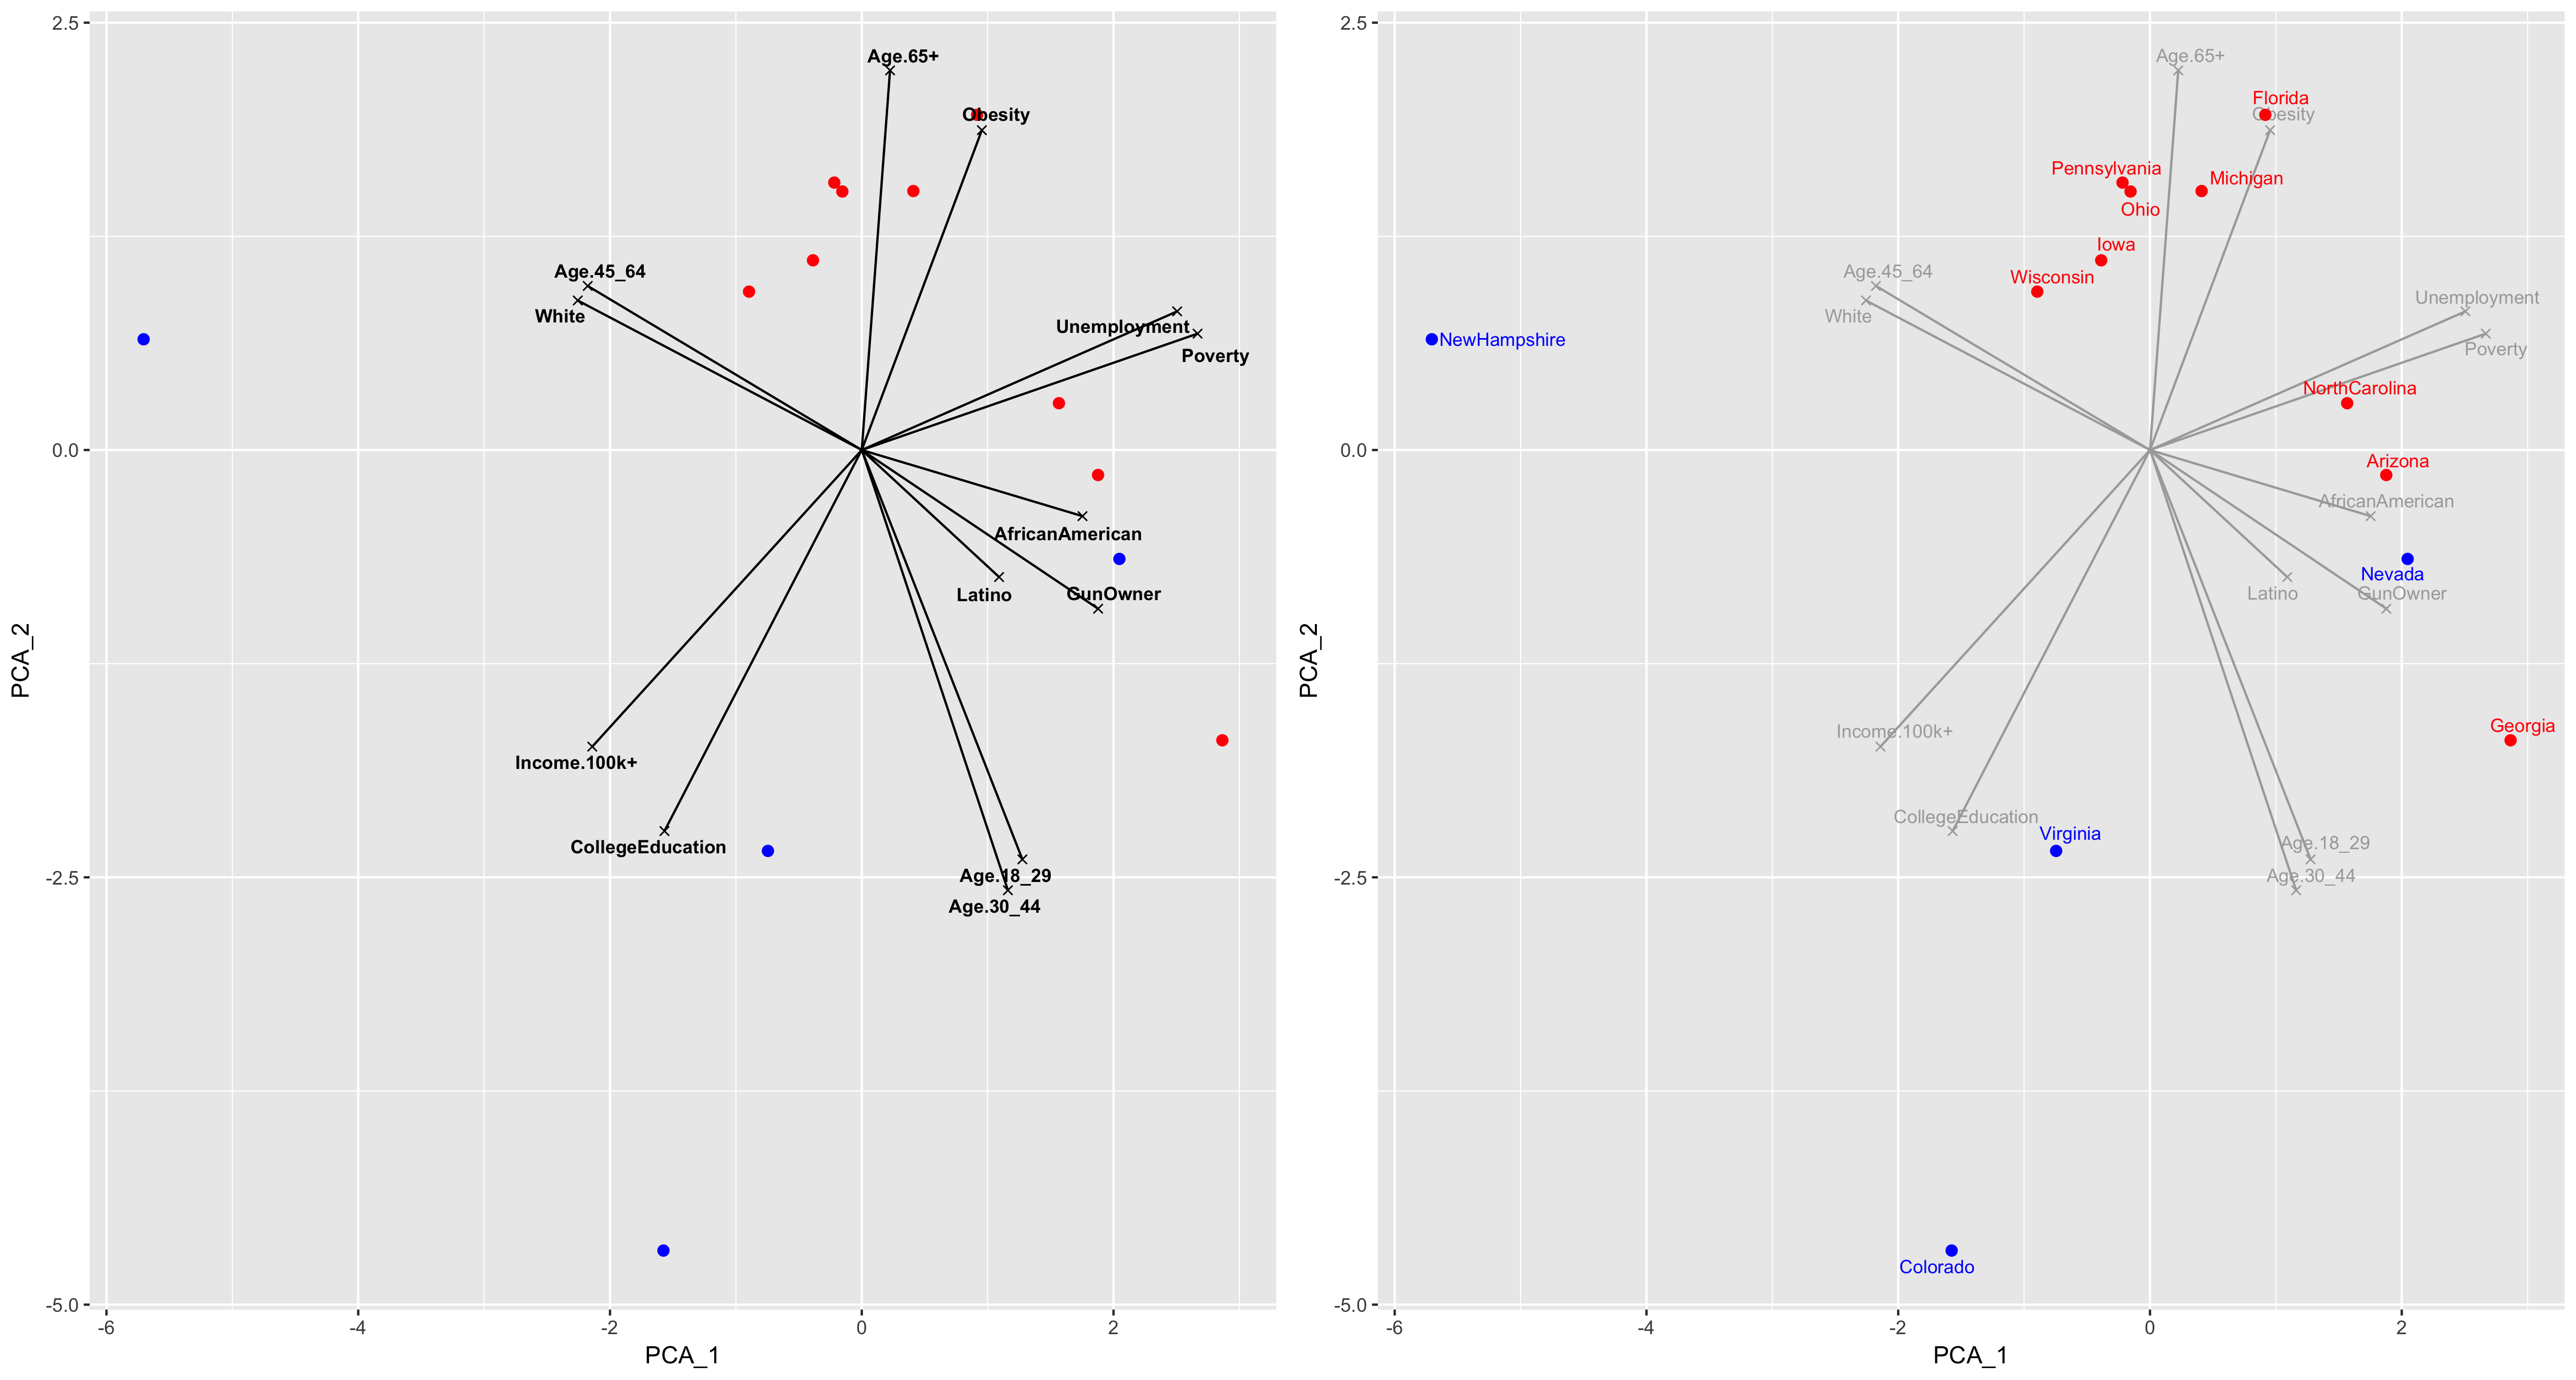
Again, socio-economic and demographic structure is similar to voting structure. New Hampshire, Virginia, and Colorado, among the wealthy and educated swing states, systematically lean democrat. With the notable exception of Nevada, swing states with high unemployment and poverty rates and a diverse population, like Arizona and Georgia, are Republican safe-holds. Finally, the older and highly unemployed states of the Rust Belt, as well as Florida, are the ones that really swung the election. These are all states that Obama carried in 2008 and 2012.
Why did nobody predict this ?
However, all these results could have been anticipated by accurate polling, and Trump’s victory was all the more remarkable that everyone failed to predict it. The main contribution of our analysis is to analyze where Trump beat the odds. We use the FiveThirtyEight state-by-state polling average as Trump’s expected scores, and define the “polling error” in every state as the difference between actual and expected result. In our PCA space of swing states, axes 2 and 3 are most relevant in defining the “polling error” vector. The explicatory variables of these axes, as well as the projections of the 13 swing states on these two axes, are visualized below.
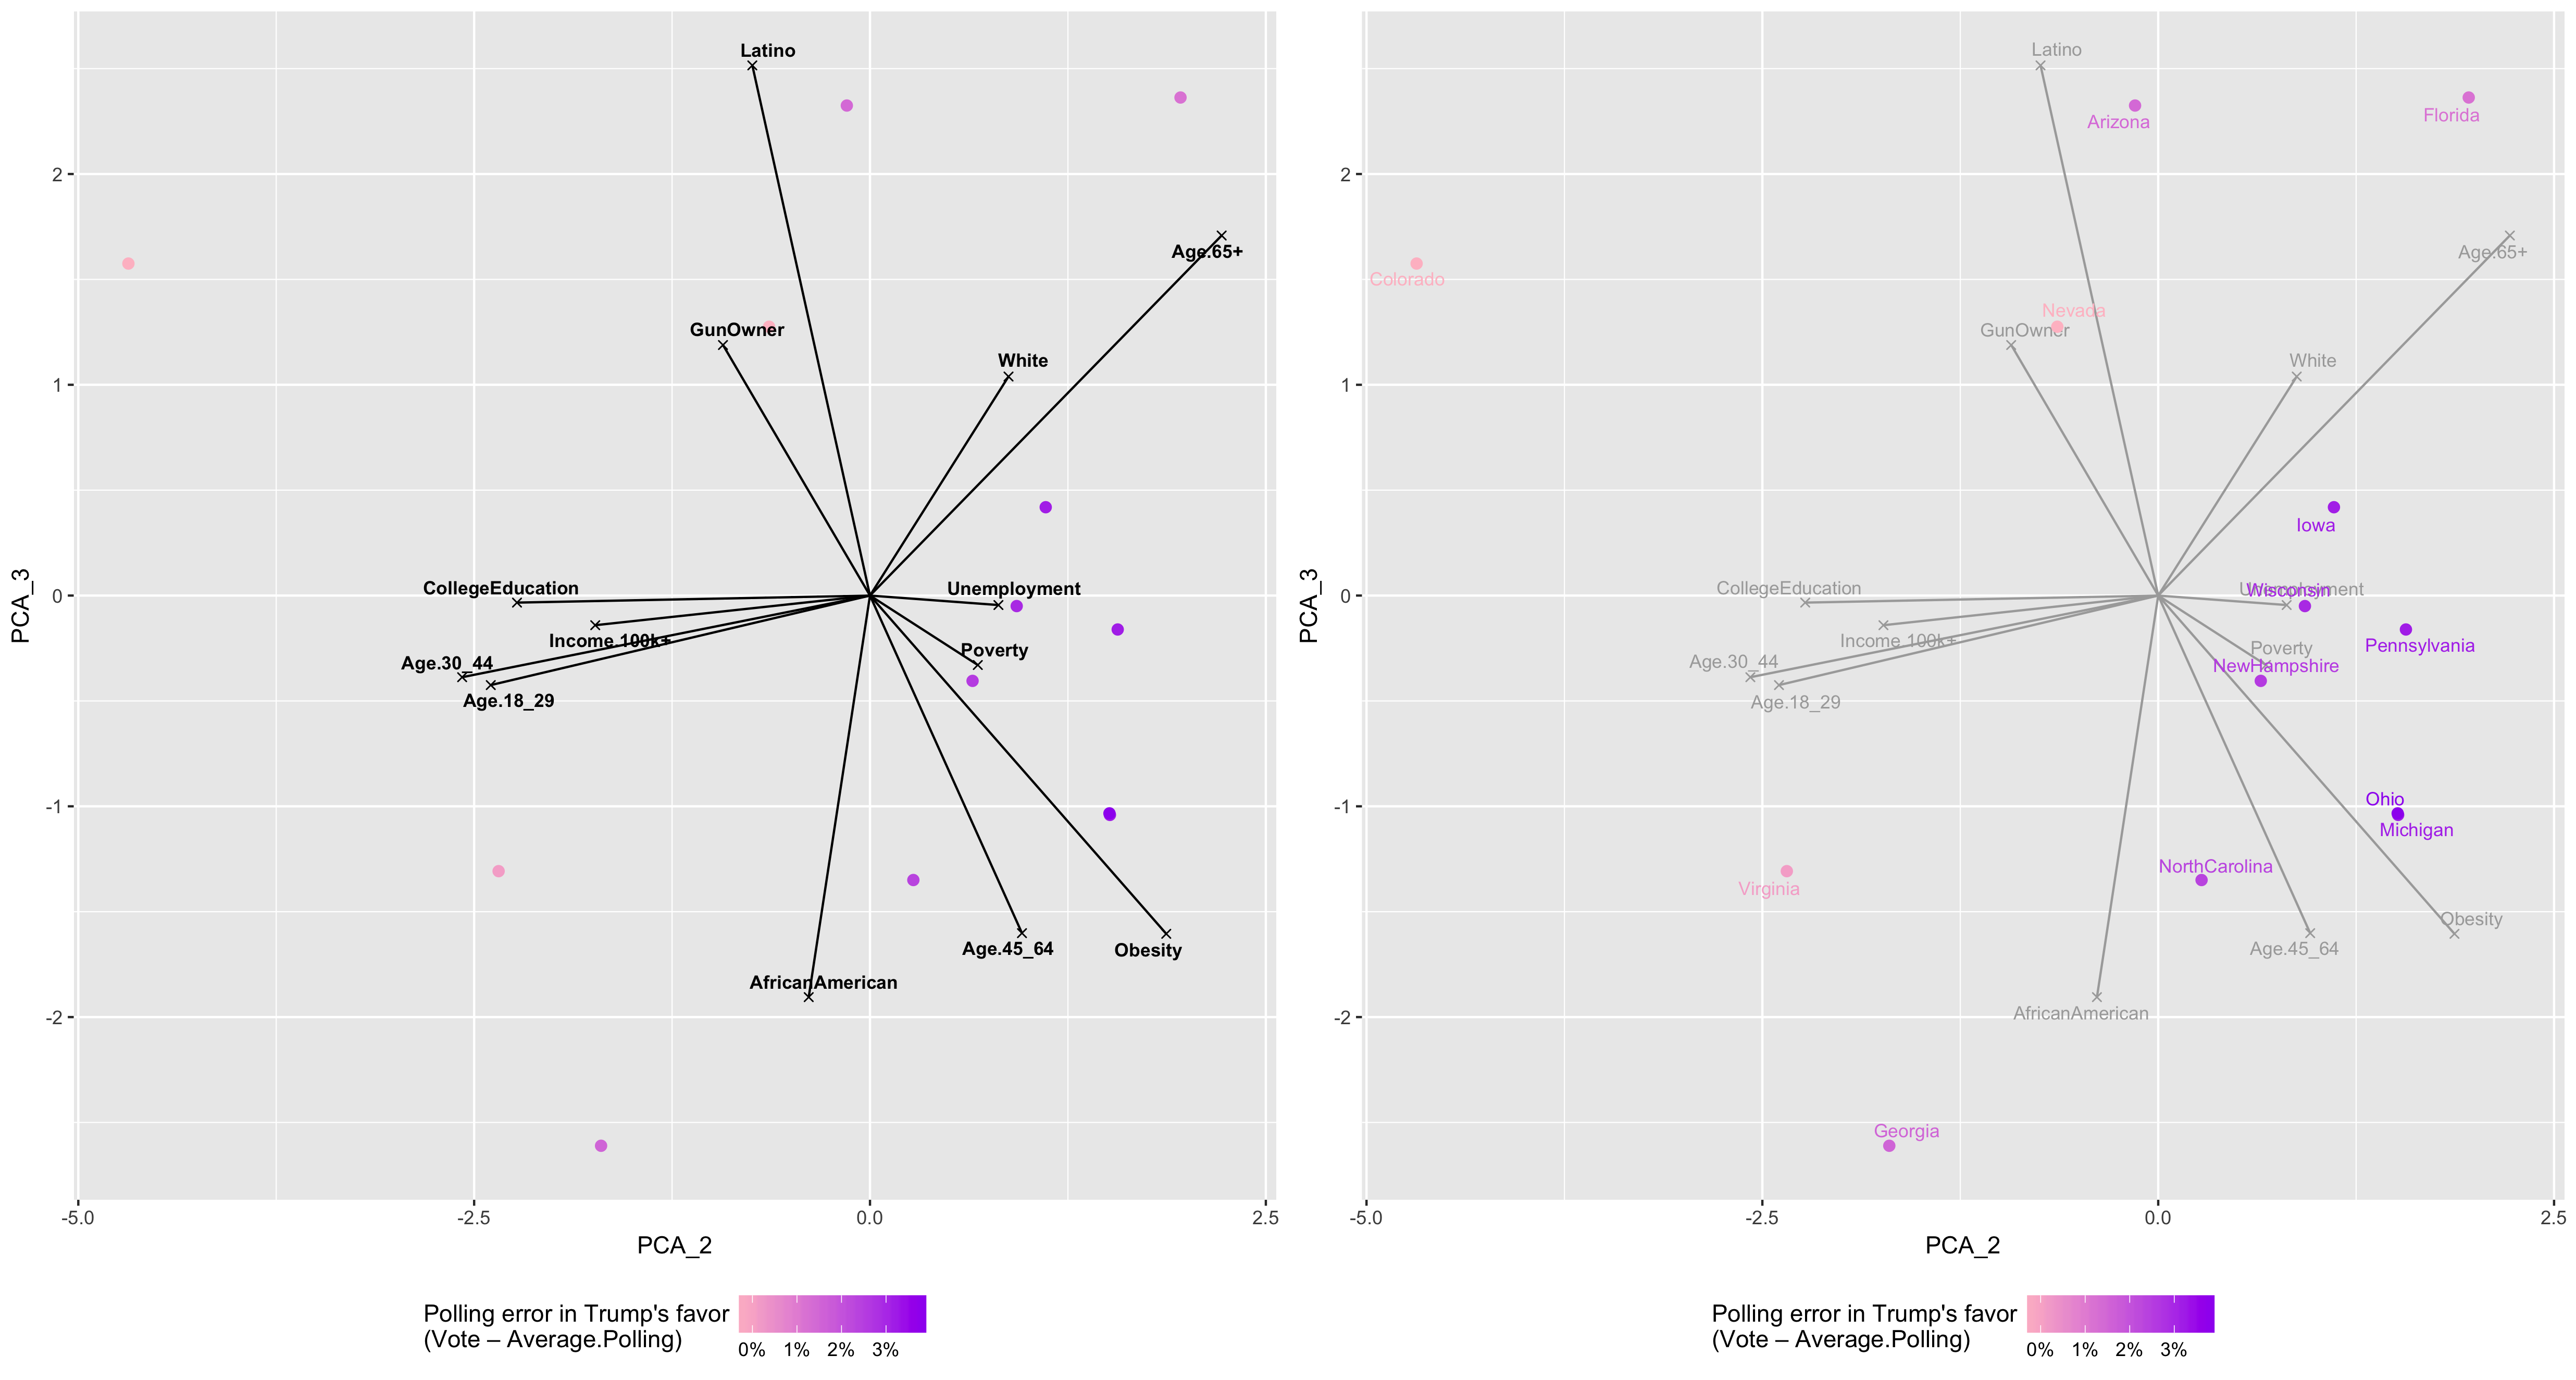
As it turns out, Trump outperformed the polls by the larges margin in the states at the lower-right of the plot—states with high obesity rates, high unemployment and poverty rates, and largely white and especially African-American populations. Based on exit polls, Trump seems to have performed exceptionally well with lower class, white individuals. Regarding the strong African-American component, two interpretations are possible. Either Trump truly did outperform with African-American individuals, a claim that many exit polls and surveys seems to contradict. The alternative explanation is that analyst models overestimated the impact of the non-white vote in these states, and that Trump outperformed in these states because the African American population stayed home. If the polling models were based on Obama’s elections in 2008 and 2012, than this may well be the case: Clinton was far less popular among African-American’s than Obama. Regardless, there is reason to think the many experts overly relied on prior belief when predicting this election, and spent too little time testing their model parameters. There’s a popular saying in Washington that every four years, the city wakes up to a new group of experts. This years, relying on the previous ones might have made us all fools.